
Dashboard and observability
You cannot fix what you cannot see. An application that depends on external APIs usually has no window into that traffic: which calls were made, what came back, and where time was spent. HARP includes a built-in dashboard, served by default on port 4080, that shows exactly what passes through the proxy, with no separate observability stack to set up.
Transactions
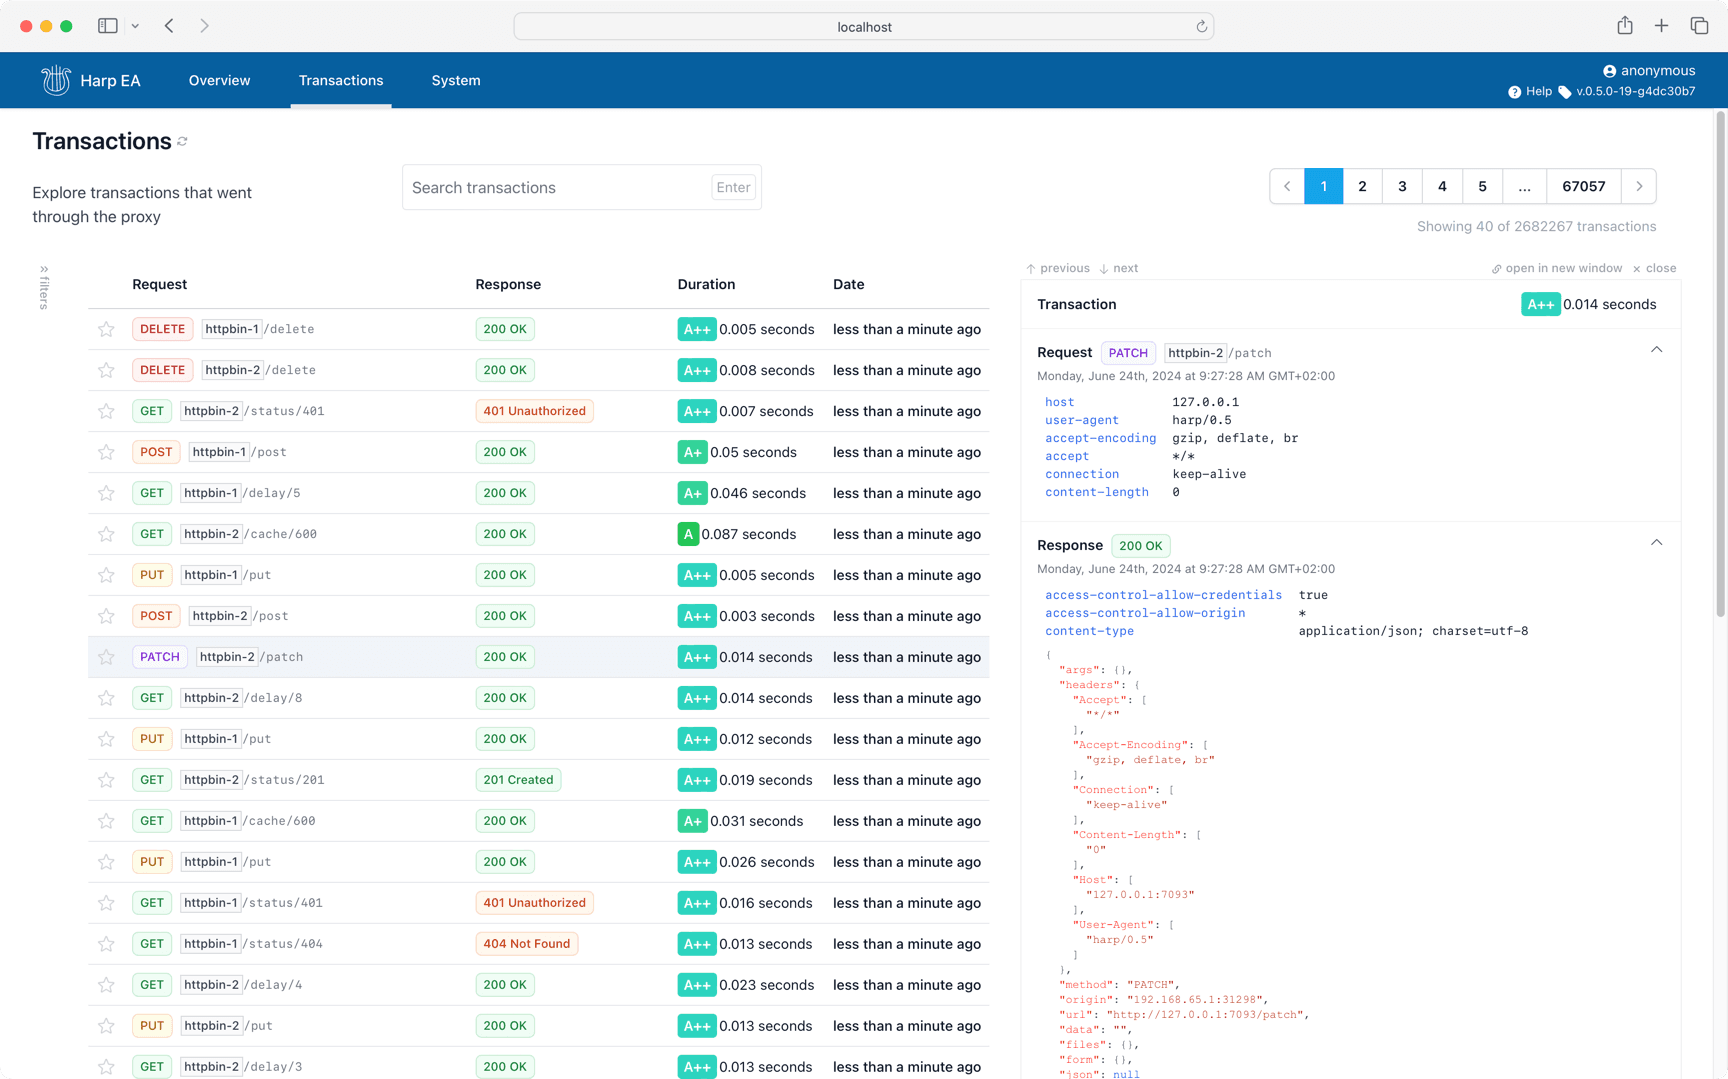
The transactions view is where you inspect individual calls. You can list, search, and filter the transactions captured by the audit log, and open any one to read the full request and response, headers and bodies included. When a call fails or returns something unexpected, this is where you find out what actually happened instead of guessing.
System and performance
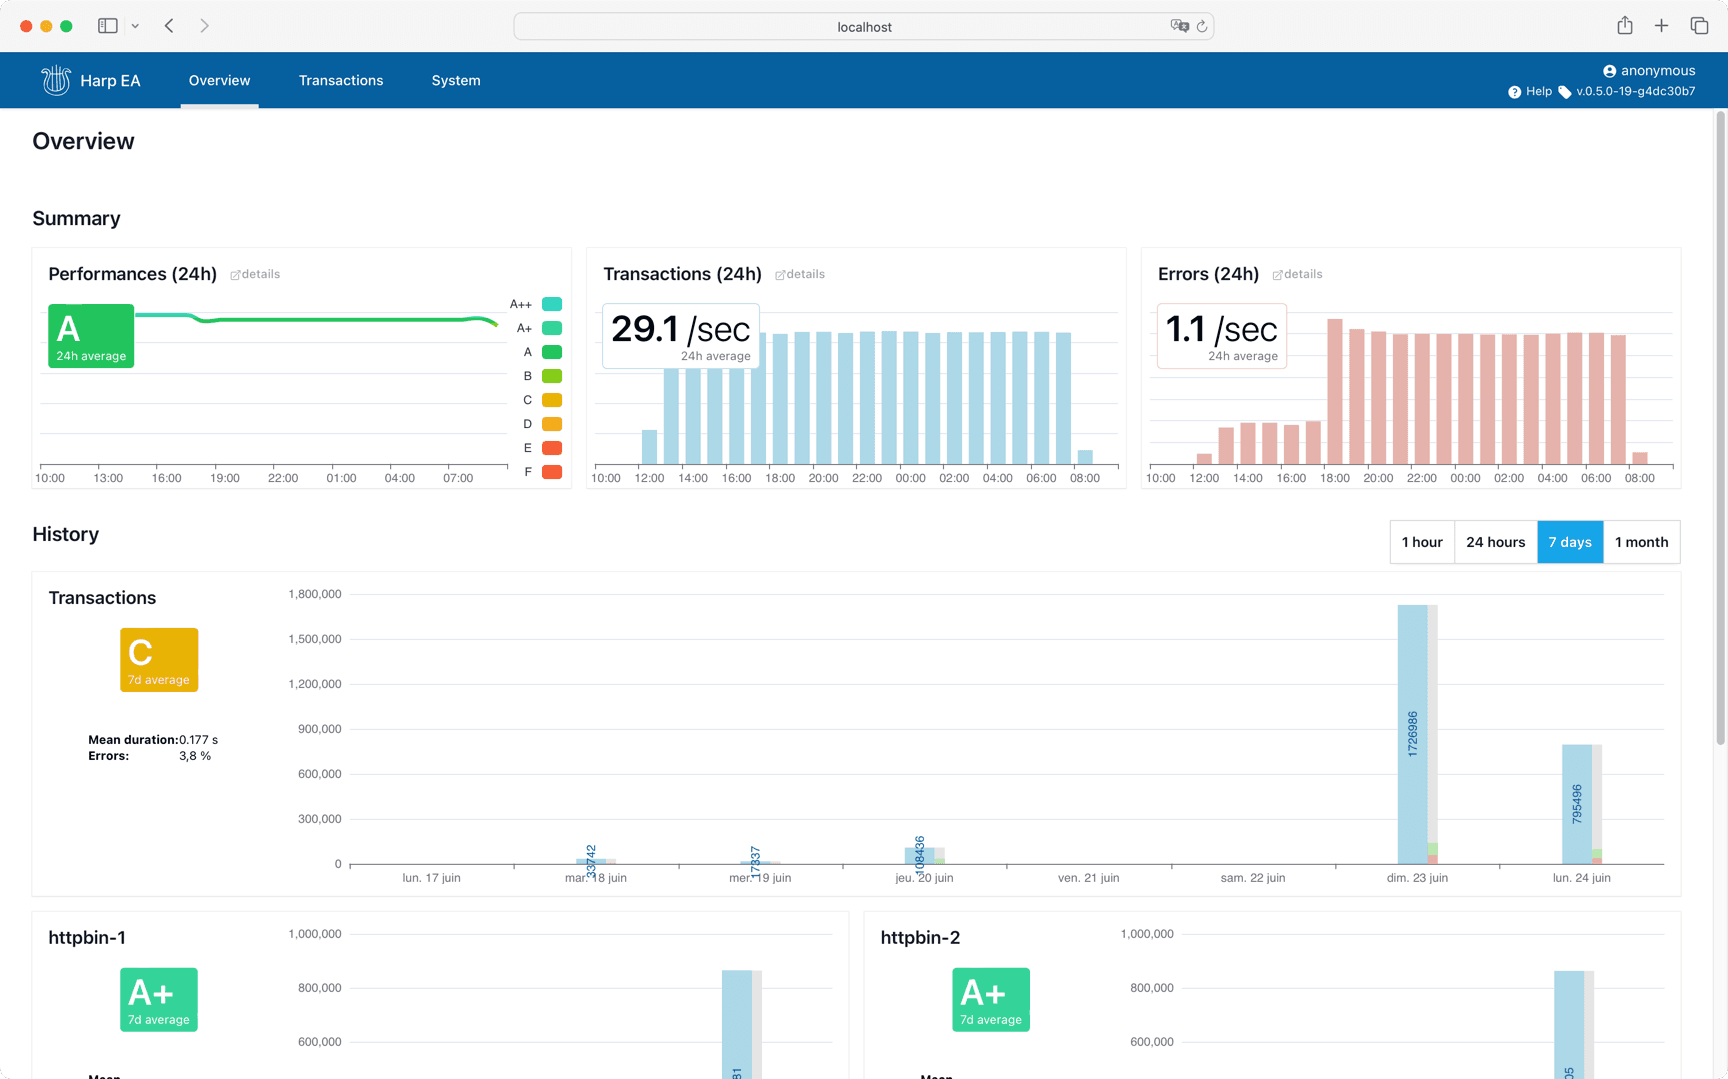
Alongside individual calls, the dashboard aggregates the traffic flowing through the proxy so you can see how your services are behaving at a glance, and a dedicated performance view helps you spot where calls are slow.
Configuring what is observed
Observability is part of the proxy, not a separate add-on. You tune what HARP captures and surfaces through the rules engine, so you can keep recording light where you do not need it and detailed where you do.